Overview
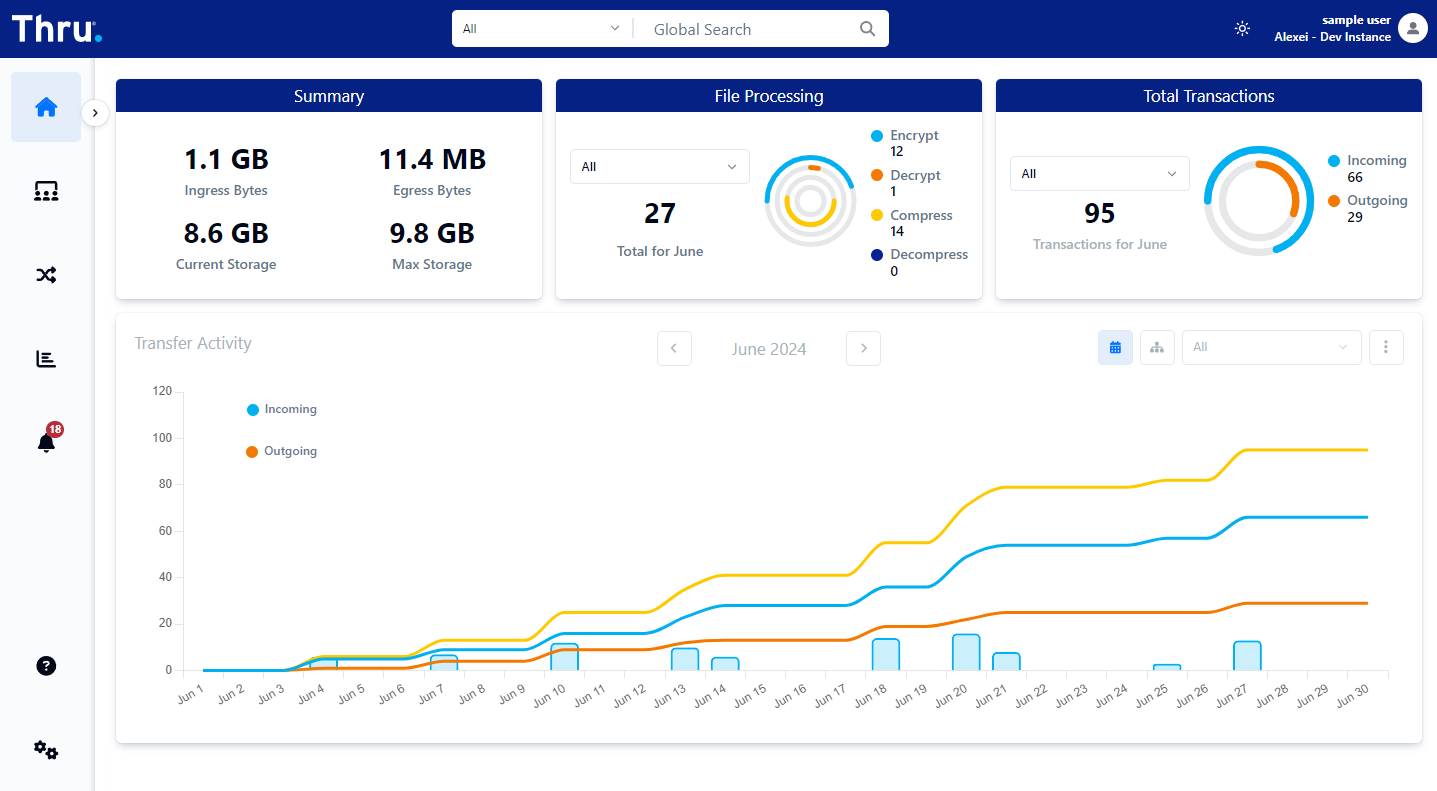
Upon logging into Thru, your initial destination is the Overview page.
The dashboard update interval is set to 3600 seconds which is every hour.
There is an additional random delay set for the first update of the dashboard after the service is first started. The first update will happen from 0 to 3600 seconds from when the instance is created.
This page features a dynamic dashboard for monitoring, displaying:
Ingress Bytes and Egress Bytes
Current storage - Amount of data currently in Thru
Maximum storage - The max amount of storage that was occupied for the month.
Count of processed files in the ongoing month
Aggregate count of transactions throughout the current month
Ongoing transfer activity statistics
Tooltips on the Overview page allow users to view Node Ingress and Node Egress information more easily.
Node Ingress | Node Egress |
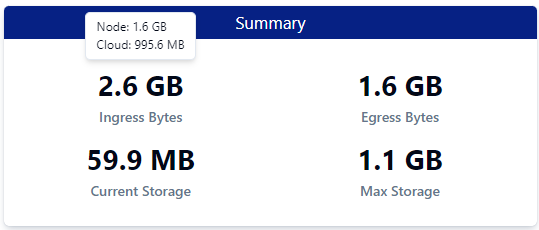 | 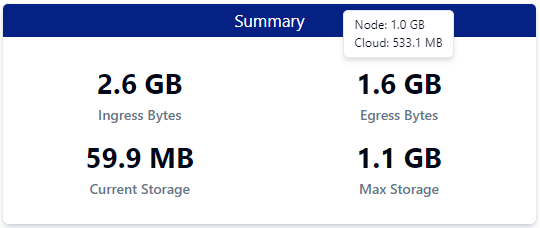 |
Transfer Activity
This area shows a live graph of transfer activity in your instance.
The graph differentiates between file transfers coming into Thru and file transfers being sent from Thru.
The X-axis shows the dates of the file transfers and the Y-axis shows the number of files being transferred.
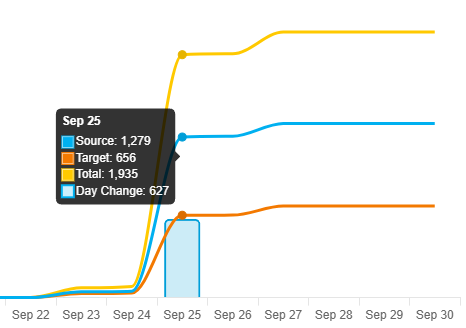
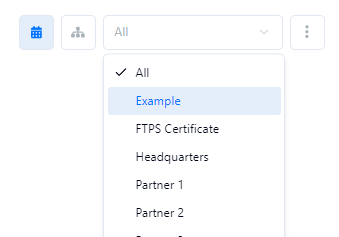
You can also filter the data to show just one organization and the monthly data can be exported to a csv file which is then made available for download using the tri-dot icon.
Overview data is also available to be consumed using the Thru.MFT.Configuration.API