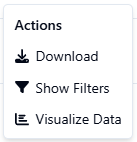
Visualize Data
Item under the reports action menu for “visualize data”
The system extracts data from the report and transforms it into a customizable graph.
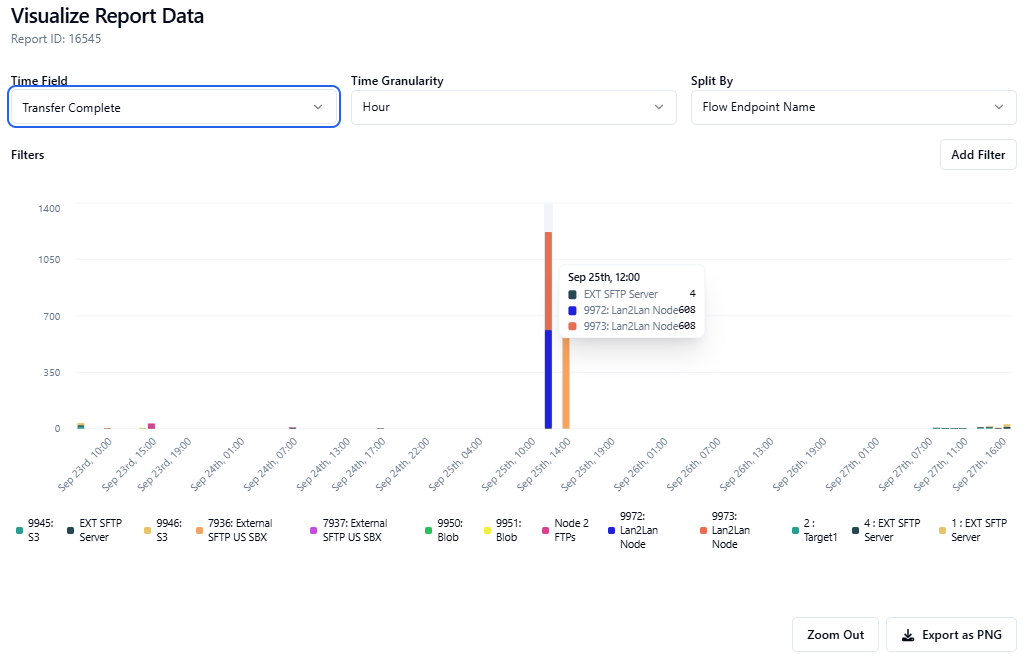
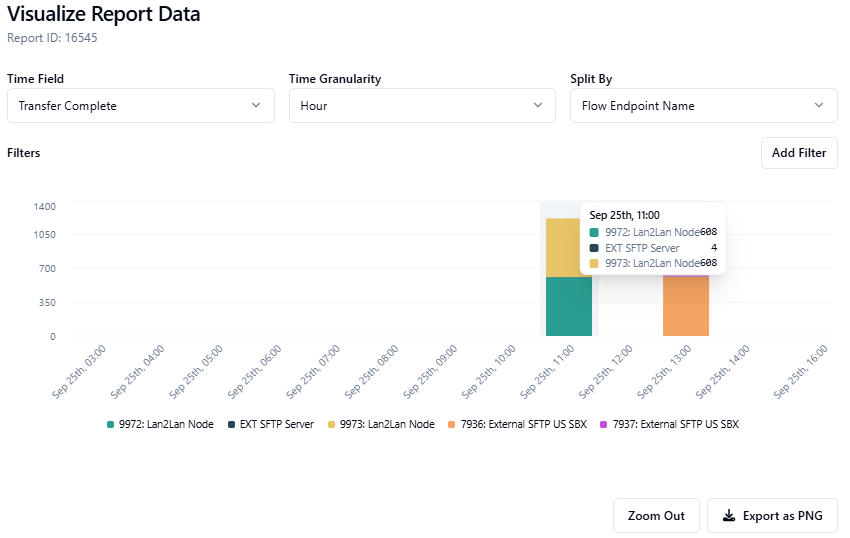
By clicking and dragging over specific sections of the report, you can zoom in to focus on that area. To return to the original view, simply click “zoom out.”
Various filters can be added to limit results in the visualization, for example, flow name, or endpoint type, or even file name.
When you have the desired time ranges and filters set, you can click the “export as PNG” button and it will download the current visualization as an image